Dashboard
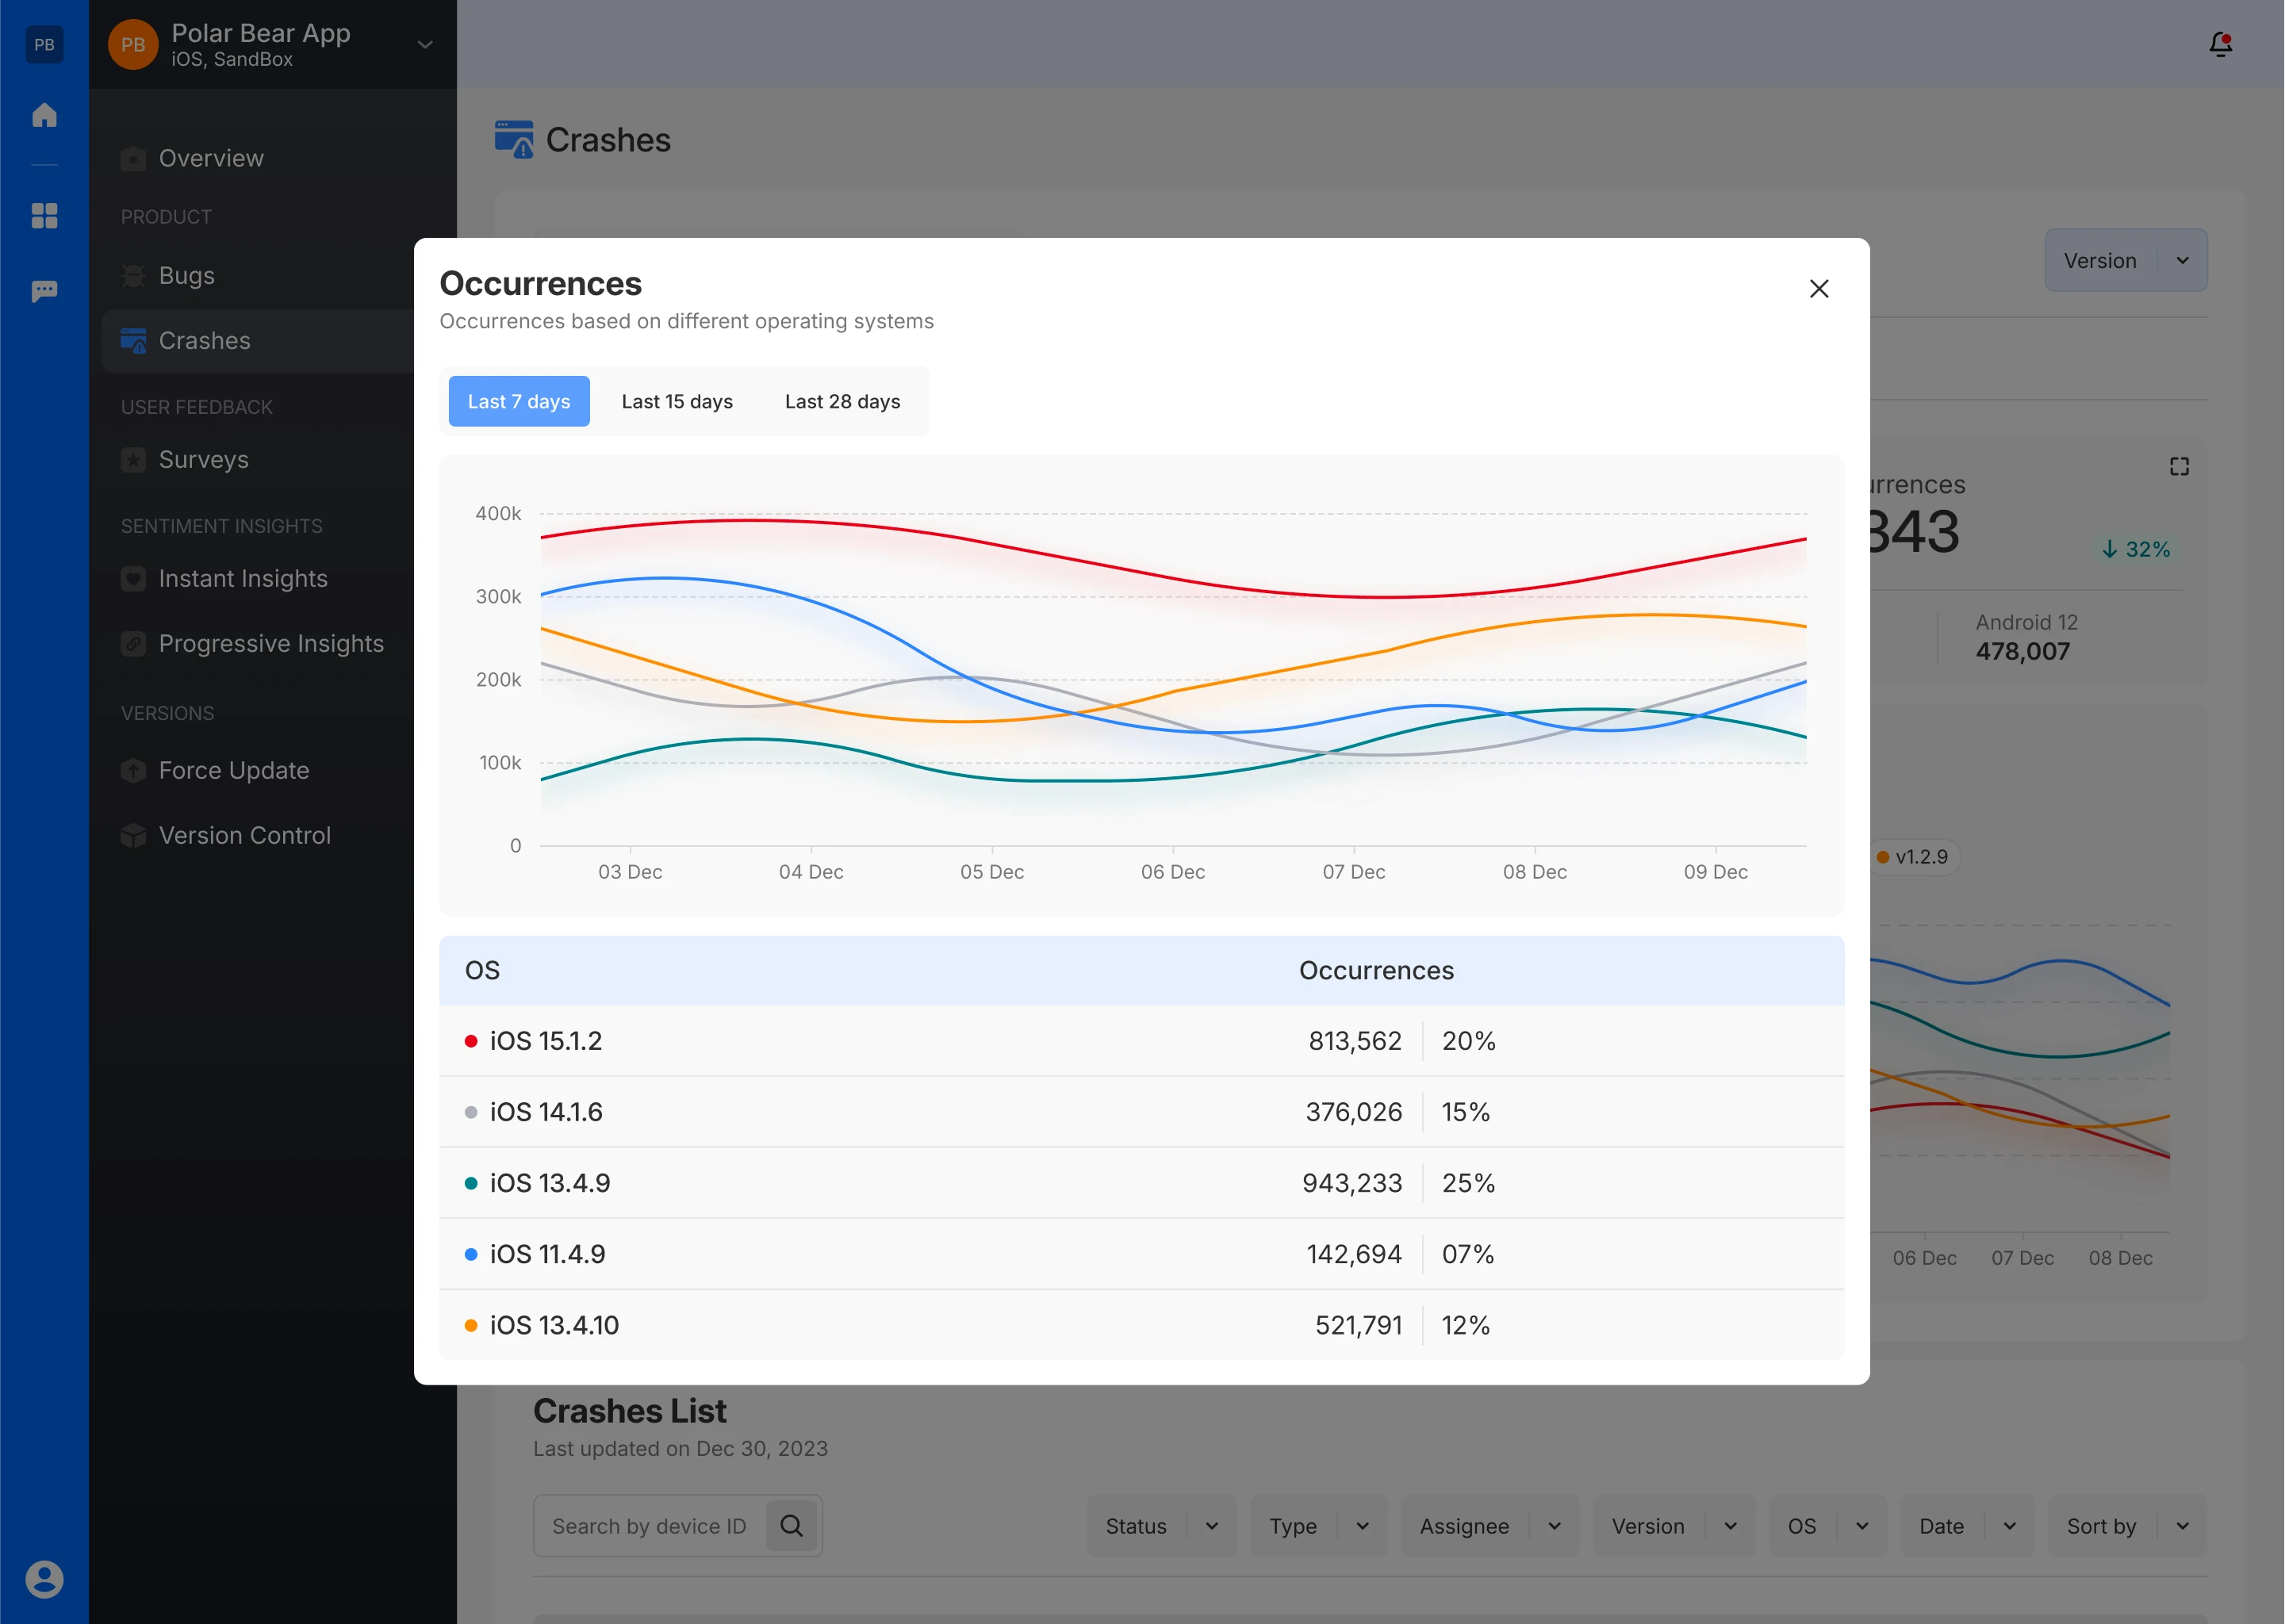
This dashboard is designed to provide a centralized view of all the crash-related data, enabling teams to monitor app stability and respond quickly to issues. The various metrics and graphs give an overall picture of the app's health, while the detailed crash list allows for deep dives into specific problems.
- Crash-Free Sessions: Indicates the total number of user sessions completed without experiencing crashes.
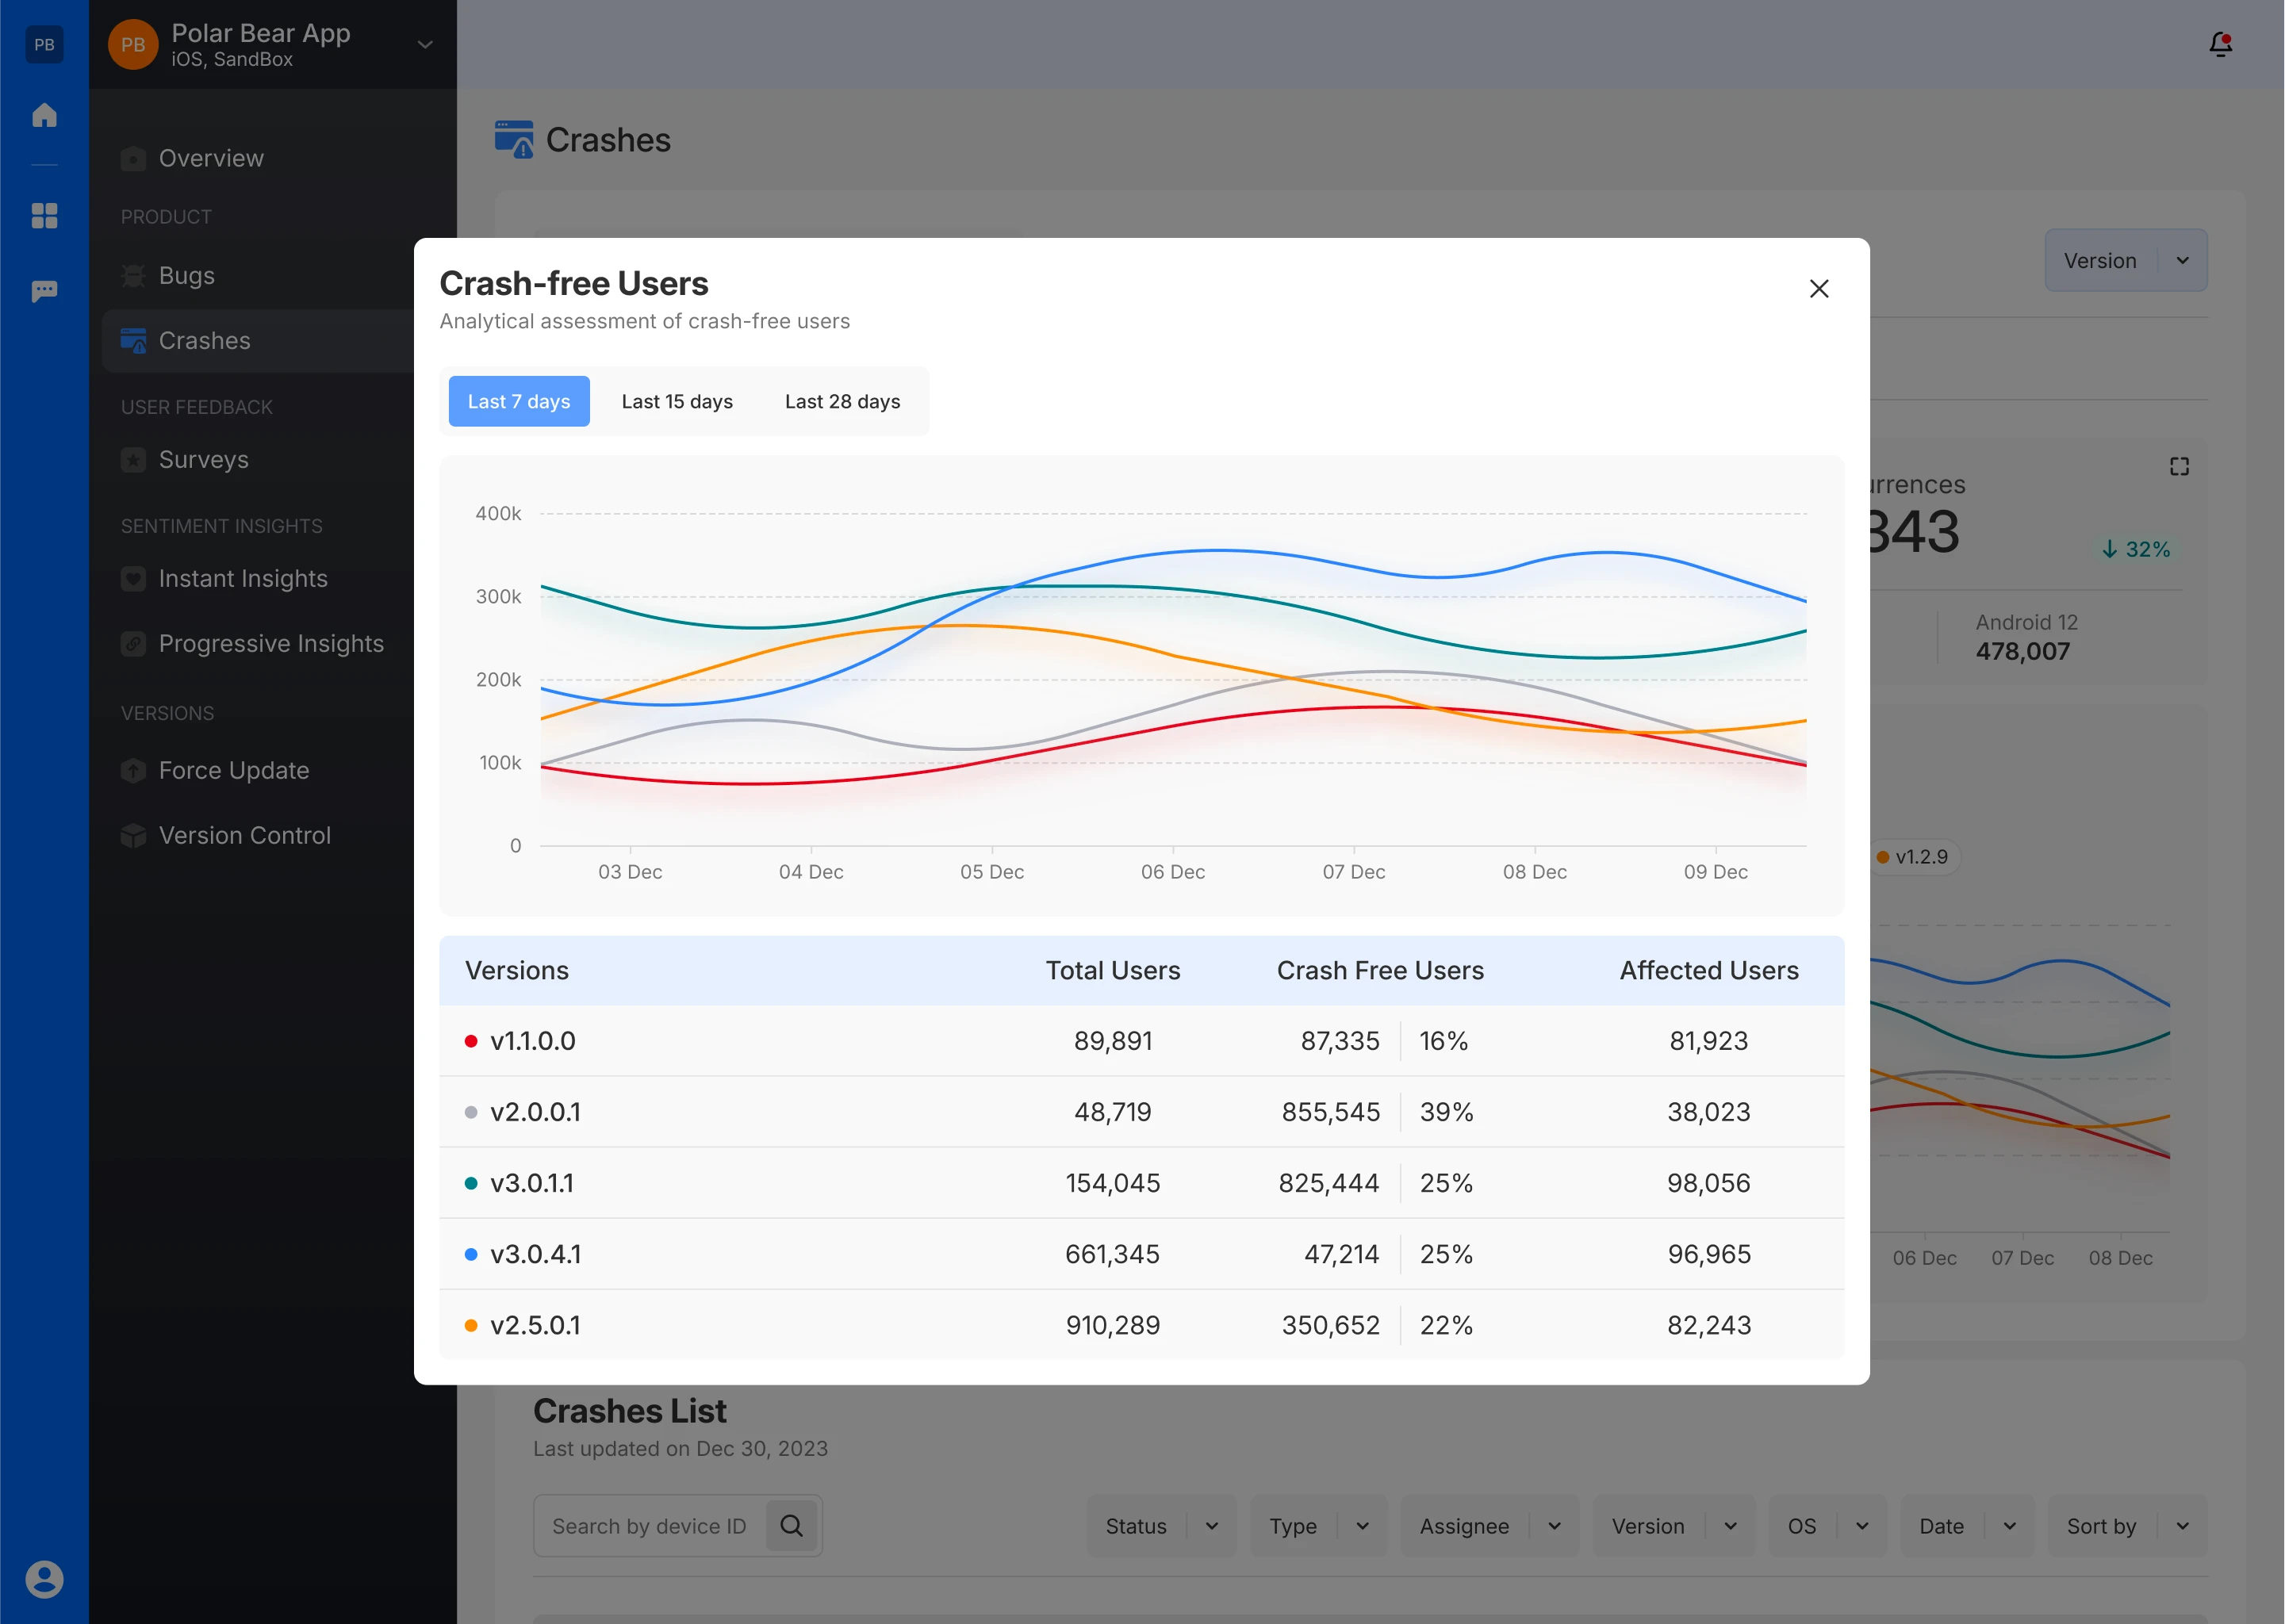
- Crash-Free Users: Indicates the percentage of users who did not encounter a crash, giving insight into how widespread the issue is among the user base.
- Occurrences: Shows the total number of crash occurrences, providing a clear measure of how often crashes are happening.
- Version: Users can filter the crash data by app version. This allows for a more granular analysis of crashes, helping identify specific versions with higher crash rates.
- Crash Reporting Graph: The graph shows the trend of crashes across different app versions over time. It helps in identifying whether a particular version has a higher crash rate compared to others.
- Affected Users Graph: This graph shows the trend of affected users over time, giving insight into the impact of crashes on the user base.
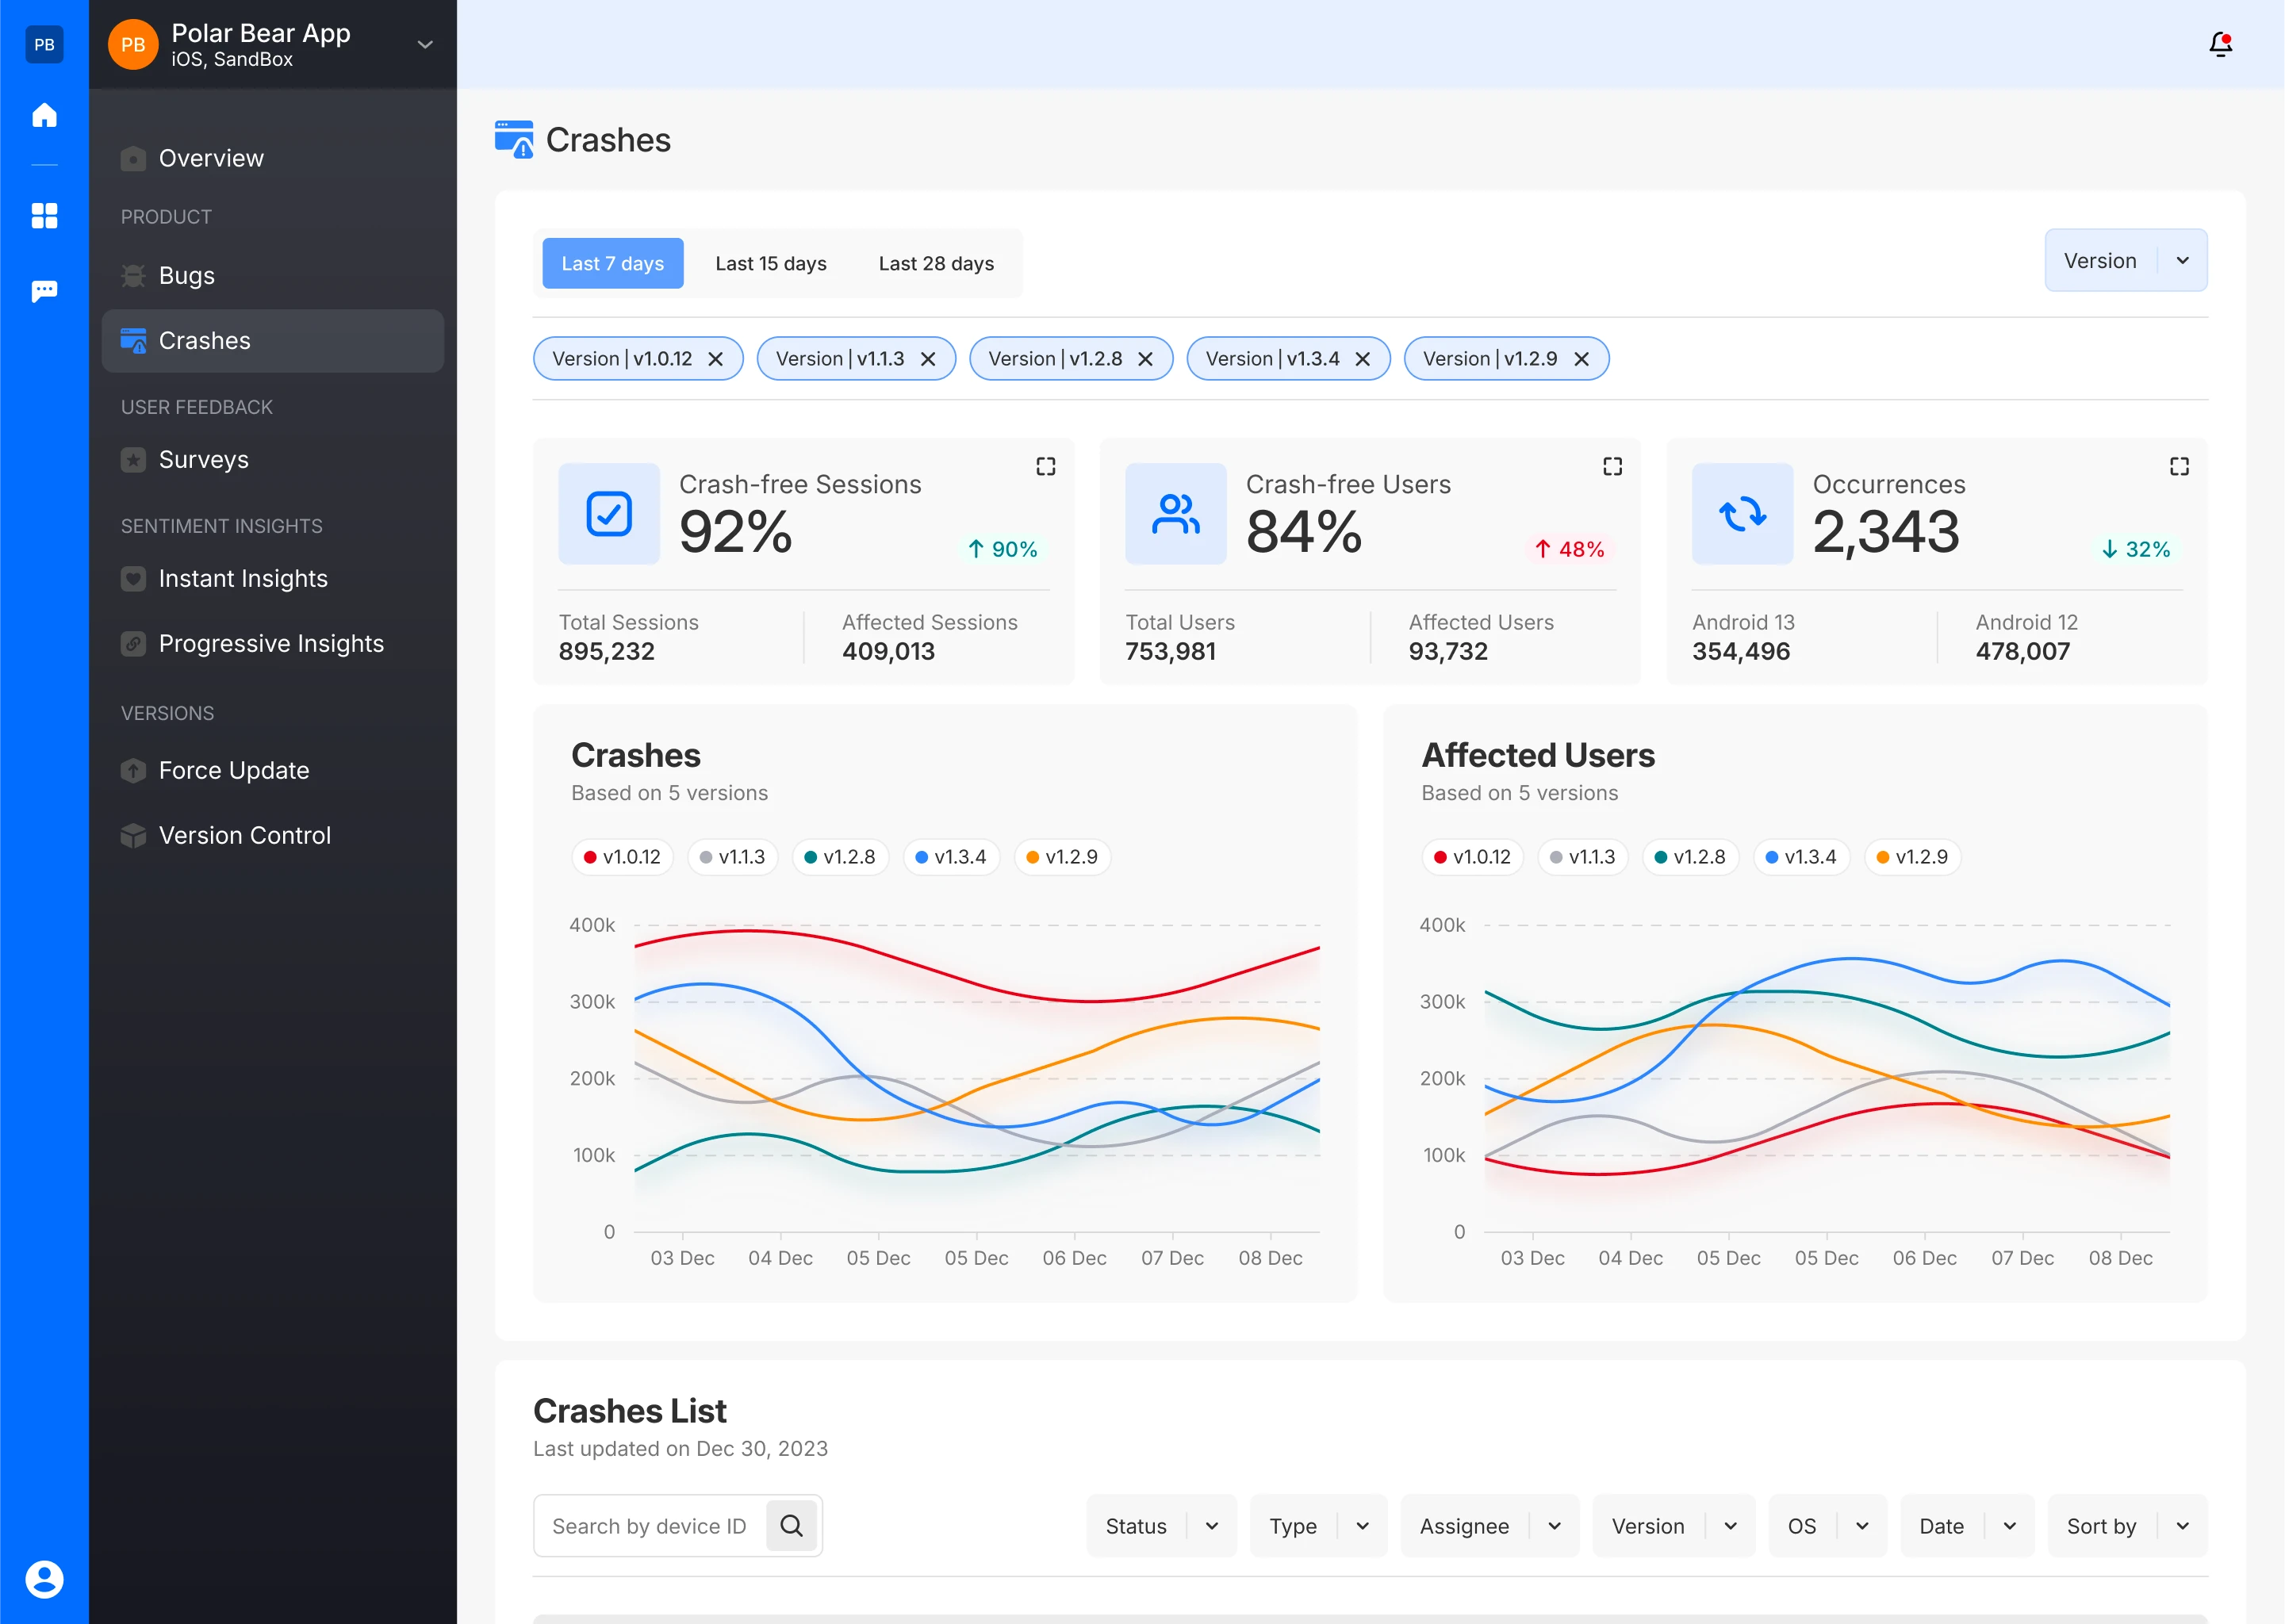
- Crash List: The list shows individual crash reports, including the crash version, number of occurrences, number of affected users, and the assignee responsible for resolving the issue.
- Assignee and Status: Each crash report is assigned to a team member with a corresponding status. This helps in tracking the progress of crash resolutions.
- Filtering: The list can be filtered and sorted by various criteria such as device ID, status, type, version, date, and assignee and This makes it easier to locate specific crash reports and manage them effectively.
- Sorting: The list can be sorted by Most Recent, Most Affected Users, Least Affected Users, Highest Occurrences and Least Occurrences.


Crash Free Sessions
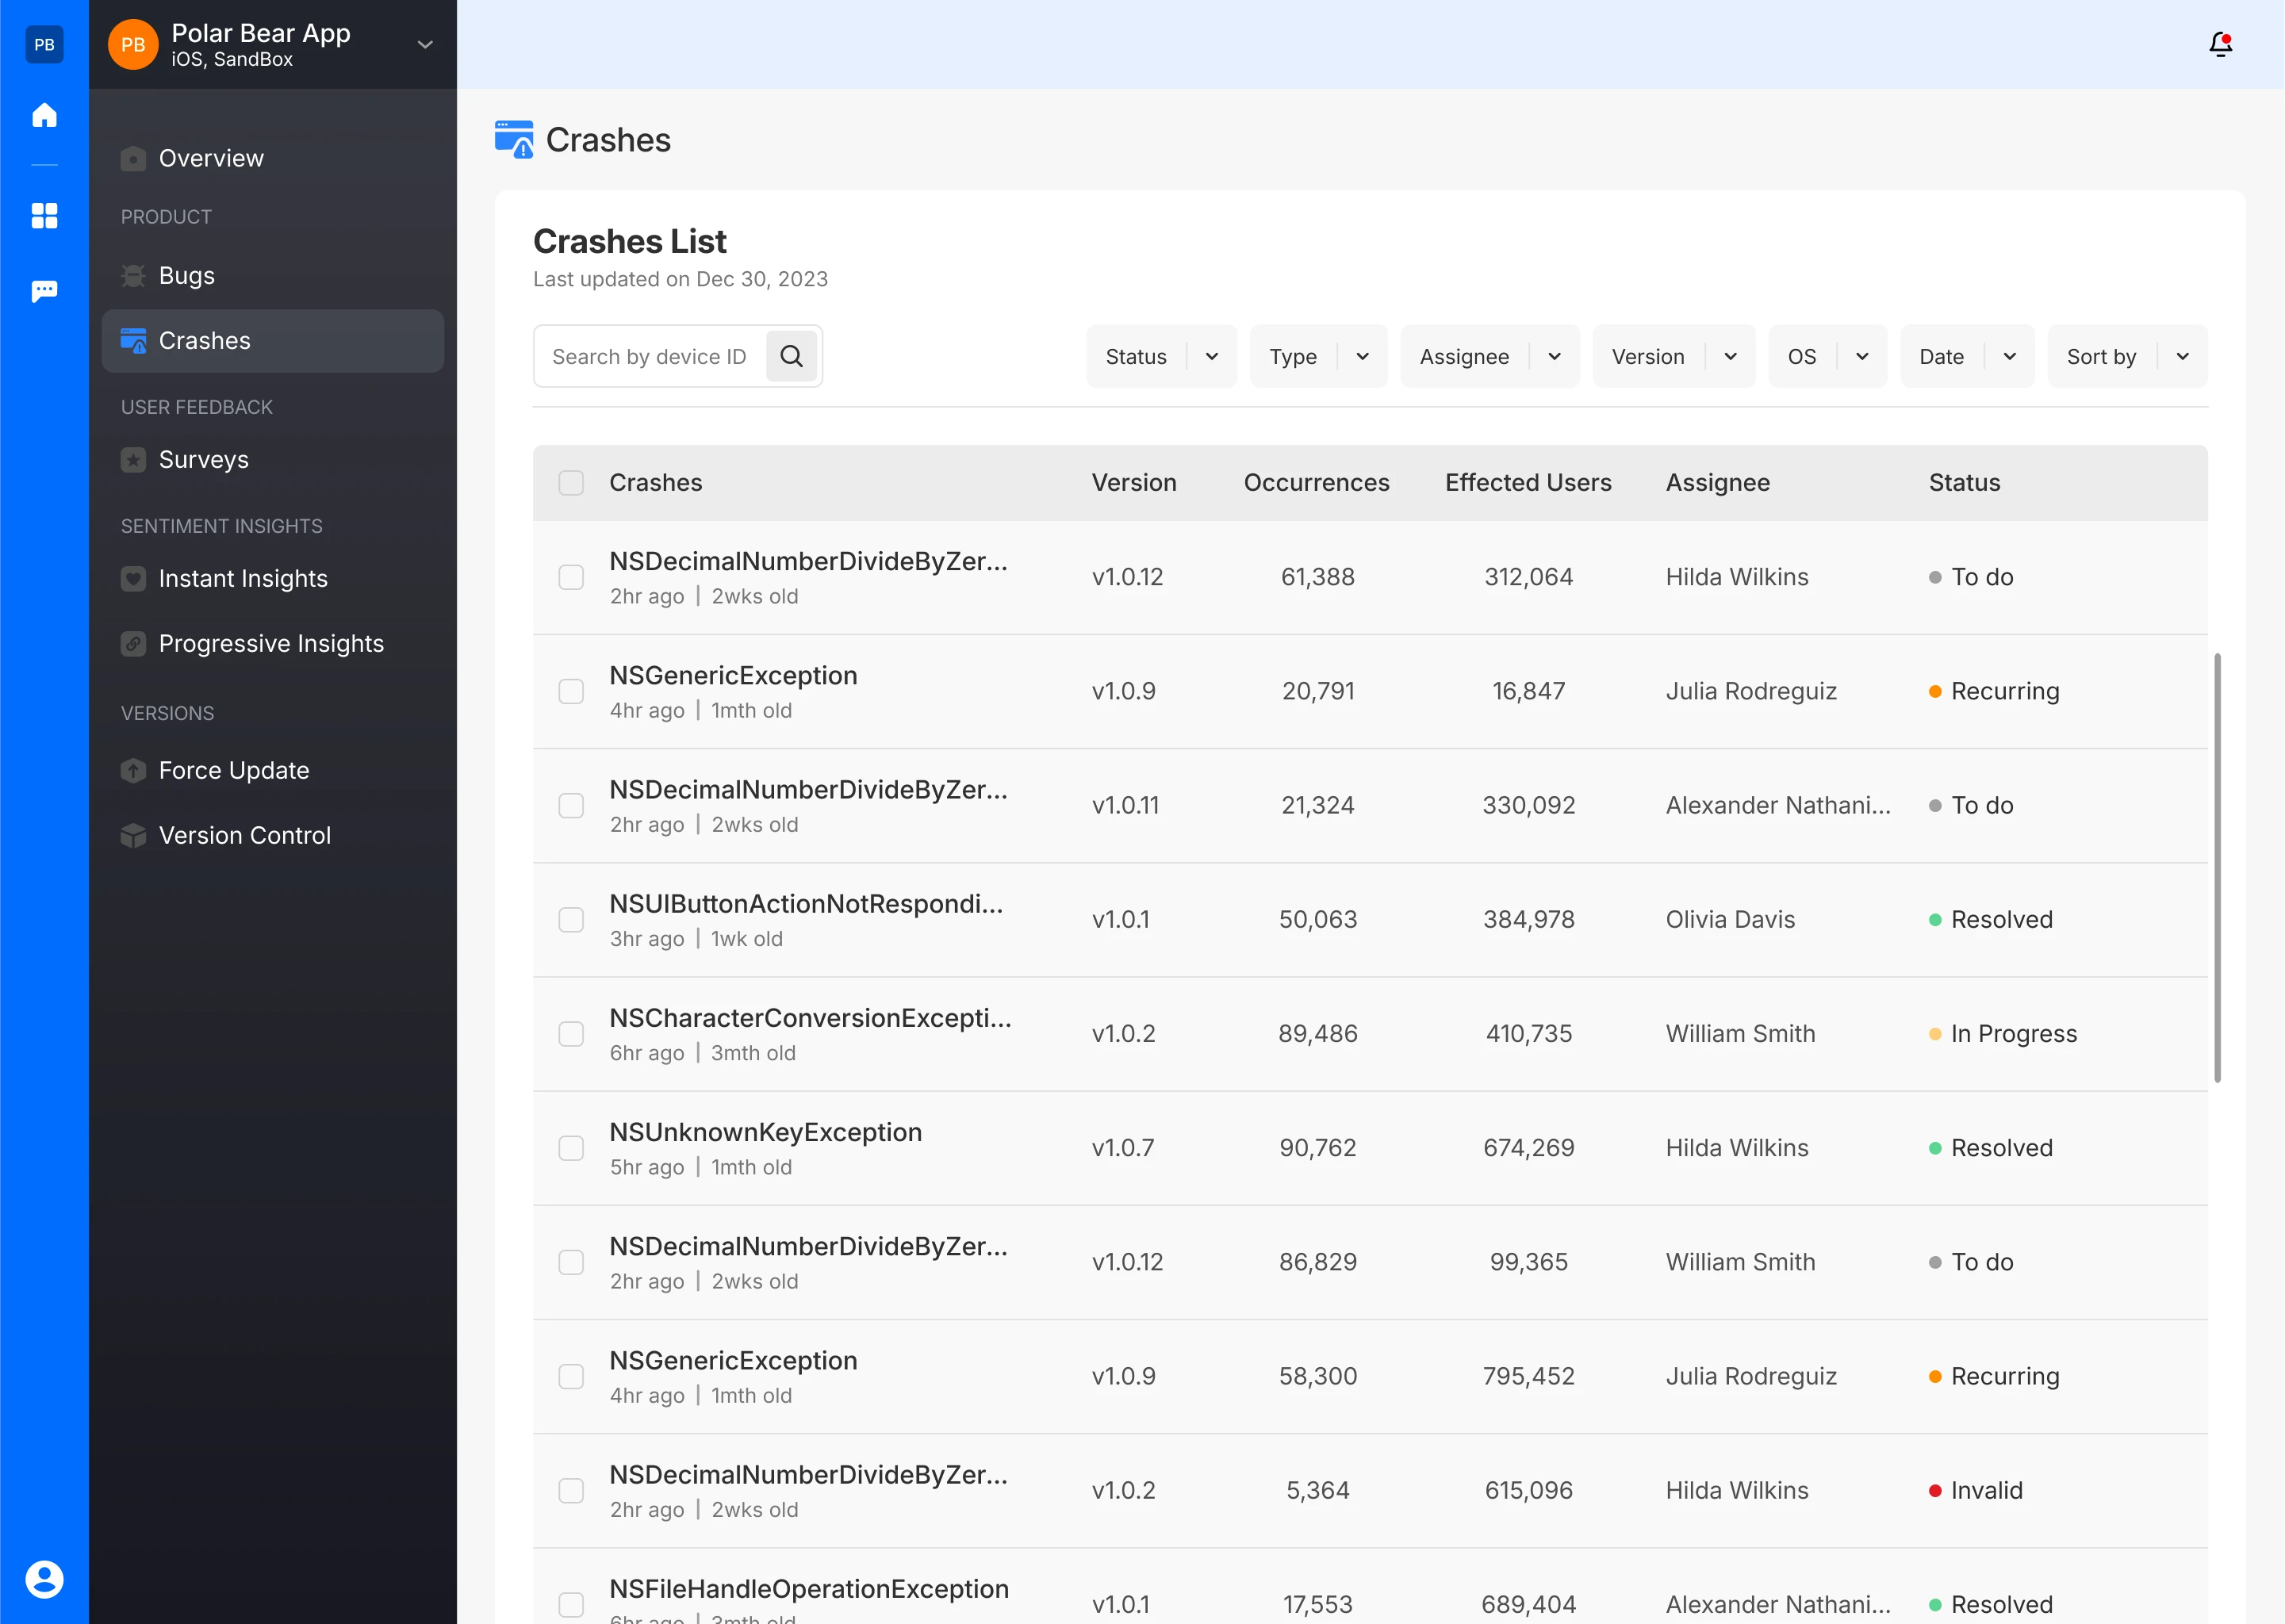
The table below the graph lists different app versions and provides specific metrics for each:
- Total Sessions: A cumulative number of sessions captured within the application over a specific period. Each session represents a single use of the app from start to finish, regardless of whether it ends normally or with a crash.
- Crash-free Sessions: Total number of user sessions completed without experiencing crashes. This metric helps to determine the stability and reliability of the application by showing the percentage of sessions that were free from crashes. A higher percentage of crash-free sessions indicates a more stable application.
- Affected Sessions: Number of user sessions that encountered at least one crash. This metric helps to determine the impact of crashes on the overall user experience by showing how many sessions were disrupted due to application instability.

Crash Free Users
The table below the graph lists the app versions along with key metrics:
- Crash-free Users: Total number of unique users who did not experience any crashes. A higher percentage of crash-free users signifies a better user experience and higher application reliability.
- Total Users: Total number of unique individuals who have used the application. This metric provides insight into the app's reach and user base, helping to understand how many people are interacting with the application.
- Affected Users: The number of unique users who experienced at least one crash during their usage of the application within a specific period. This metric helps in identifying the proportion of the user base that is affected by crashes, providing a clearer picture of how widespread crash issues are among the user population. A higher number of affected users indicates a need for urgent attention to improve application stability.

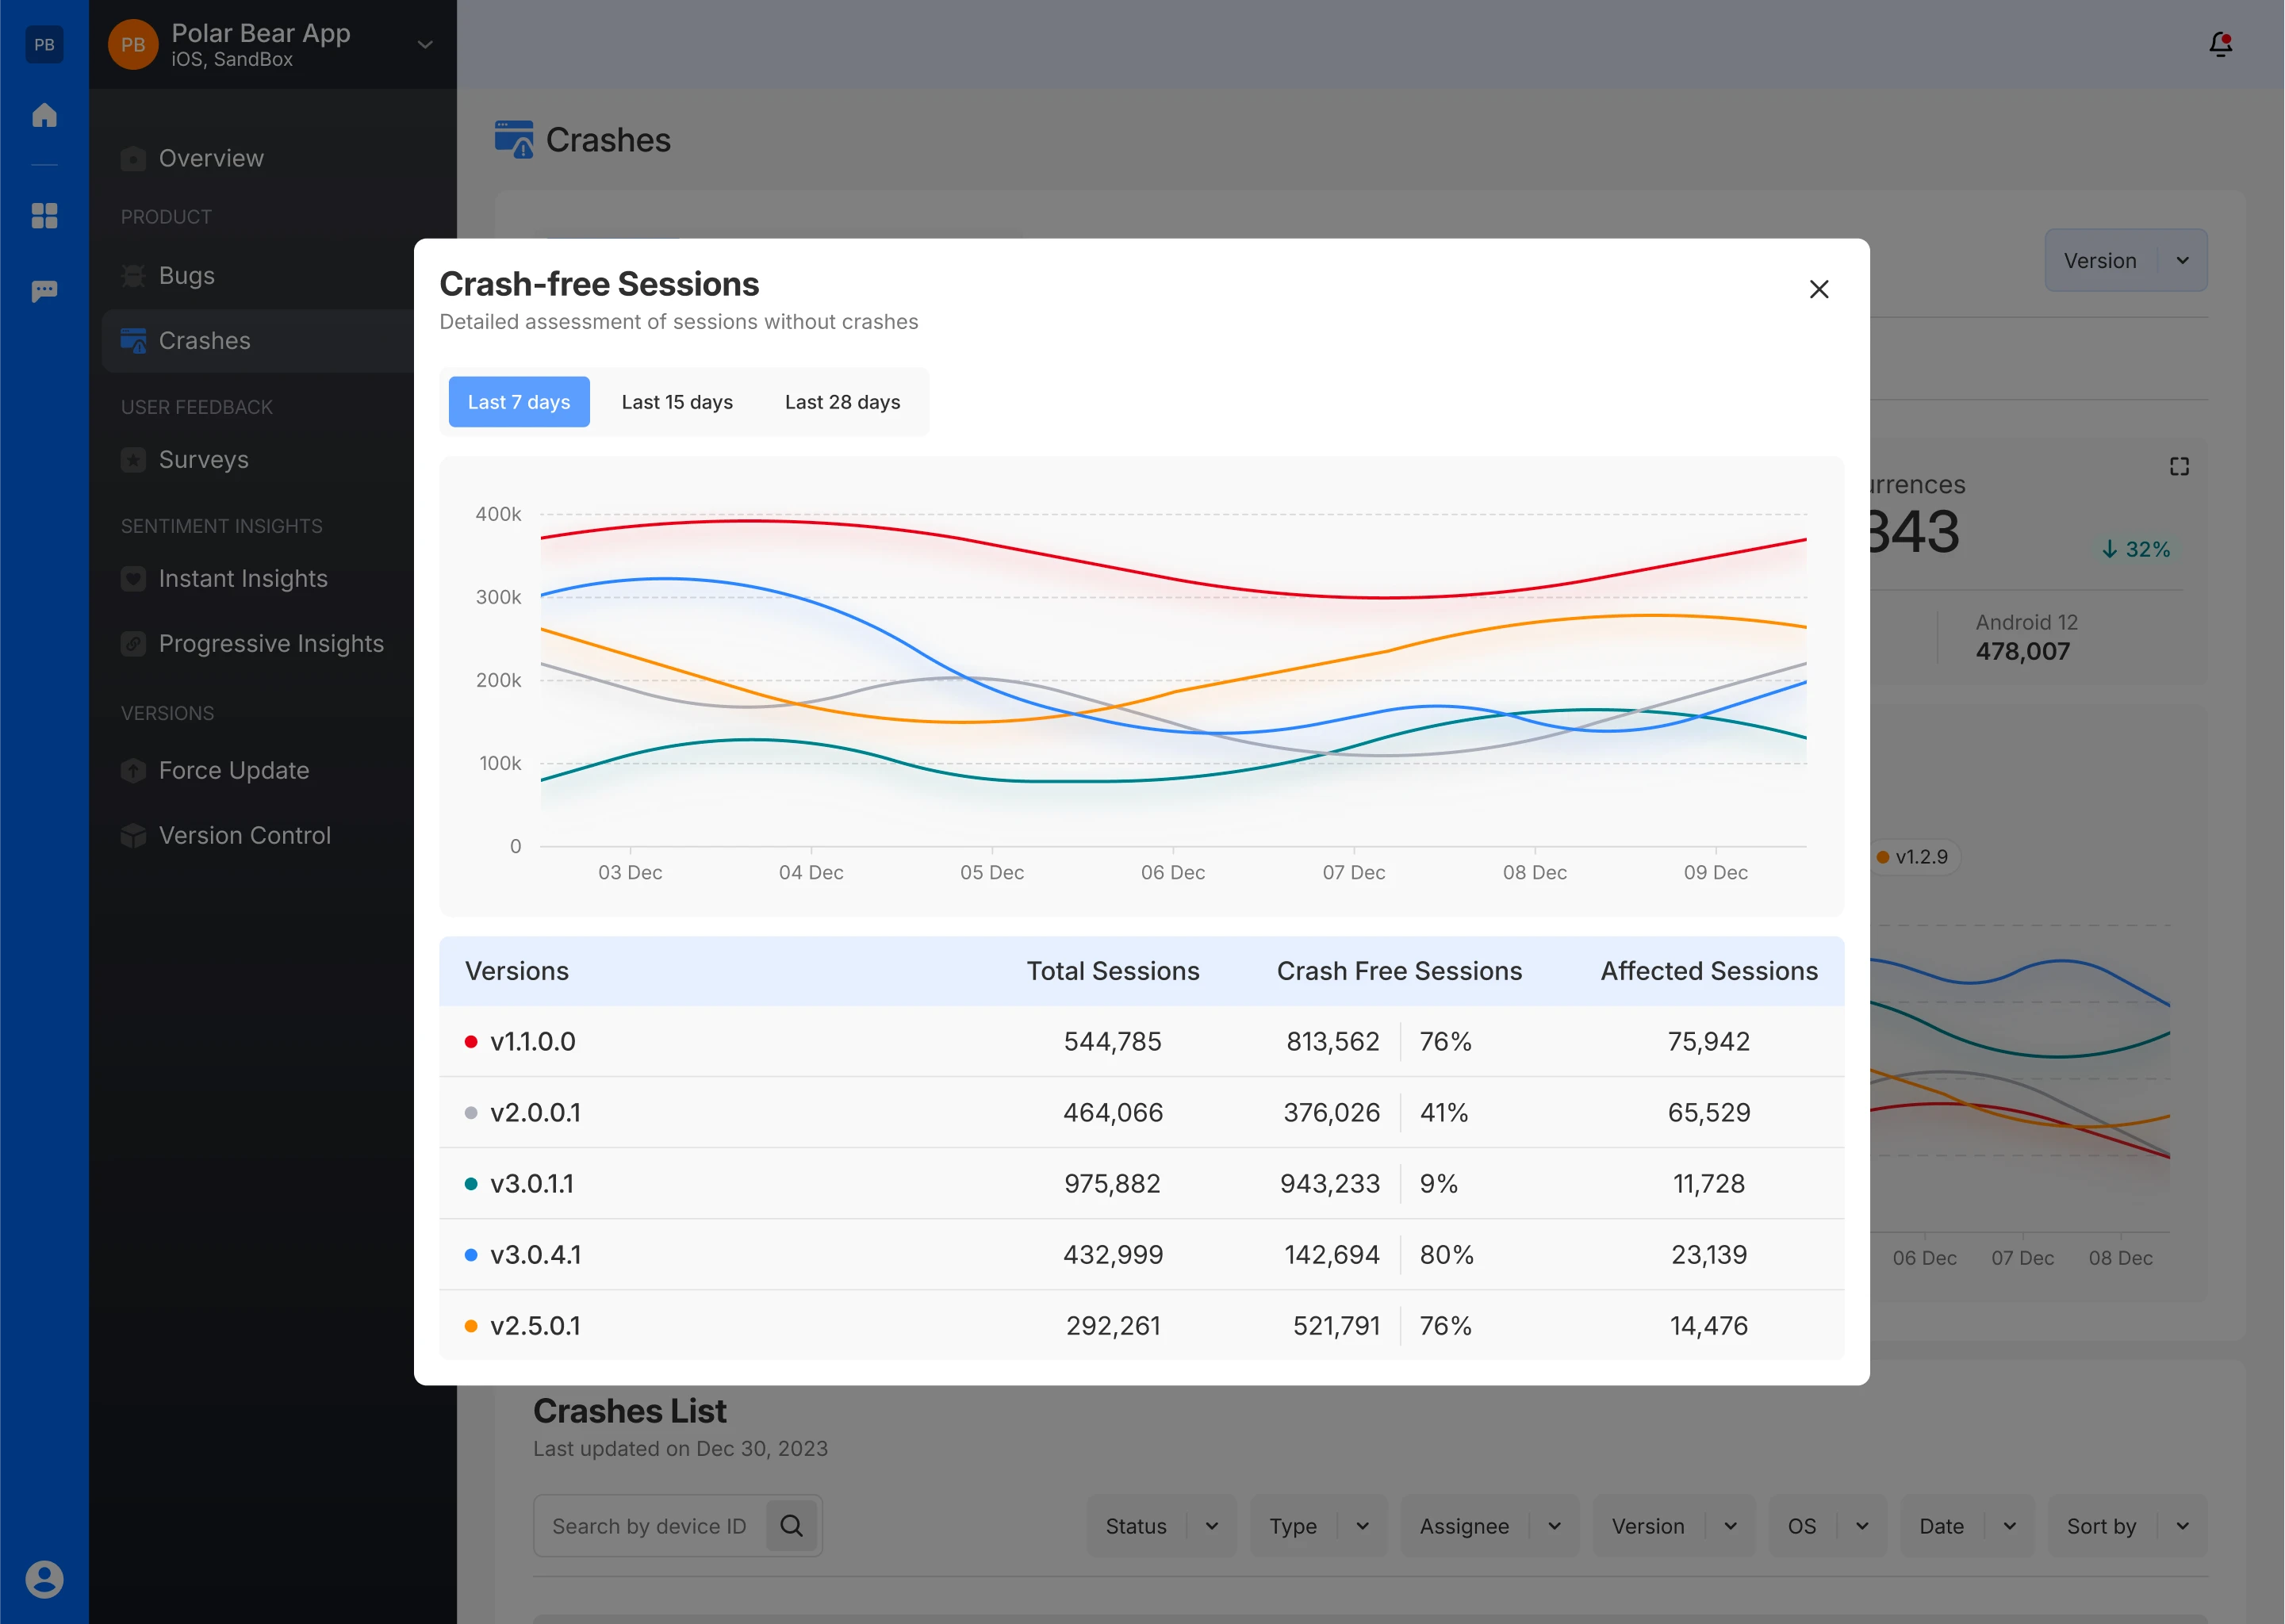
Occurences
Total number of crashes that were captured. Each occurrence represents a single instance where the application crashed. The same nature of crashes can occur multiple times for the same user or different users
